


Measuring something like ads or SEO is natural—there are clicks, pipeline, and open rates—it’s not always so easy with events. But the move to virtual gatherings has created a digital footprint flush with qualitative and quantitative insights that most marketers are yet to capitalize on.
It’s time to look at measuring event impact in a whole new way. Here’s everything you need to prove ROI and impact on your stakeholders.
What you’re measuring, what you’re not
It’s a common notion that events are a lead-generating mechanism. Many who take a macro view of event data only measure with that one goal in mind. To prove that objective, they might look at:
- Registrations
- Attendees
- Leads and demos
- Pipeline and revenue
- Poll responses
But when you consider events through such a singular lens, you miss out on so many opportunities to prove impact elsewhere. Events aren’t just about MQLs and conversion, they can help you grow your top-line brand awareness, brand acquisition efforts, and direct traffic.
In order to measure toward these goals, you might look at areas like:
- Customer loyalty
- Customer retention
- Referrals
- Engagement touchpoints
- Event quality
Of course, not all of these areas have an easy-to-use yardstick. Concepts like “quality” are notoriously difficult to measure, but all this requires is a little out-of-the-box thinking:
Pre-event quality might be determined by things like turnout rate and live attendance
Mid-event quality might be determined by things like session sit-through rate, participation in polls, number of booth visits
Post-event quality might be determined by things like NPS, social media mentions, feedback, and repeat attendees
Start considering this data holistically and you’ll start to understand how many touchpoints events truly have, and what an ecosystem of growth they can be. Once you start measuring what previously seemed unmeasurable, you’ll have plenty of data to support your future budget asks.
How to extend scope and budget for events
Having more spend means being able to provide better experiences for your audience, but C-suite executives require deep dives, charts, numbers, and a lot of green on your dashboard before they’re willing to increase your budget and extend the scope. That means you need to get tactical with your approach.
Demonstrating the following numbers is a great way to prove ROE to your stakeholders. To collect data that can prove merit, ask yourself these questions:
What kind of accounts are you bringing to events—even if they’re not converting right away, building relationships is an important step
Did you see an increase in organic brand searches post-event?
What level of speakers and partners are you attracting? Showcase how you’ve entered a new tier of authority and credibility
Have your events resulted in customer testimonials that create online brand reputation?
How is your customer retention? Determine the dollar value of engaged accounts—if 10 customers worth $10k each of business return to your events, you’ve engaged $100k worth of attention
Have you noticed any account expansions? Draw a parallel between the number of events attended and the number of expanded accounts
Once you can demonstrate these numbers, you’ll be better equipped to tie your events directly to the success of the overall business.
Use a metric matrix to most effectively measure your events
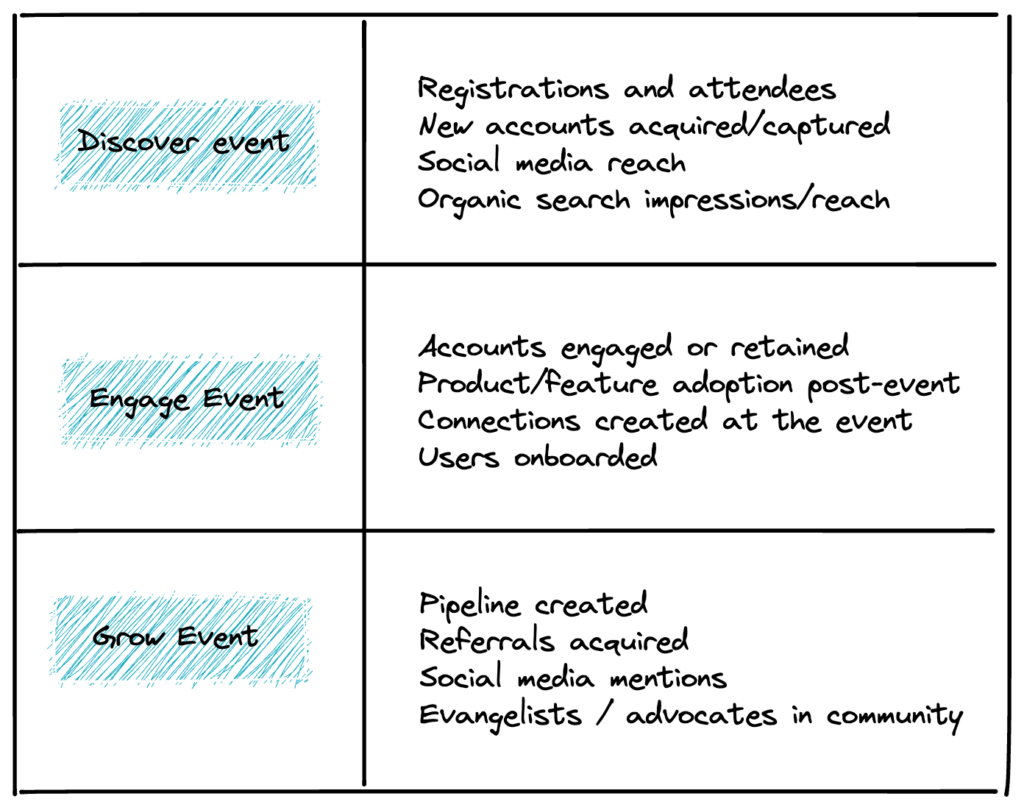
Using Event-led Growth (ELG) as a framework helps you see two new truths about events:
- Events are not one-time occurrences but a continuous growth mechanism
- Events have a multivariate structure for multiple use cases
Achieving goals comes down to setting the right expectations. You set yourself up to best measure your event success by selecting the right metrics. Run your event plans through this matrix to determine which metrics are the best fit for you—understand that you can’t use the same metrics for different event types:
What type of virtual event is it?
What is the desired outcome?
What’s the funnel stage?
What’s your audience definition?
For example, if you have a cold audience, you shouldn’t seek to measure the networking connections made or pipeline achieved. This type of event is about creating brand awareness and engaging a large audience enough to create repeat audience members.
Projecting numbers in advance is another good way to build the case for events. Here are some formulas you can use to create some structure around your projections:
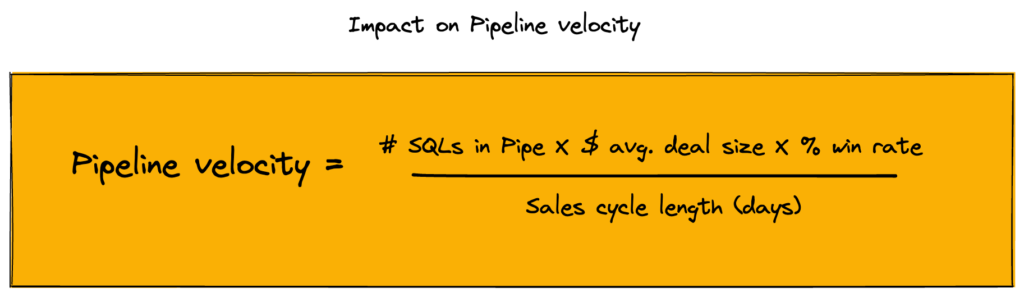
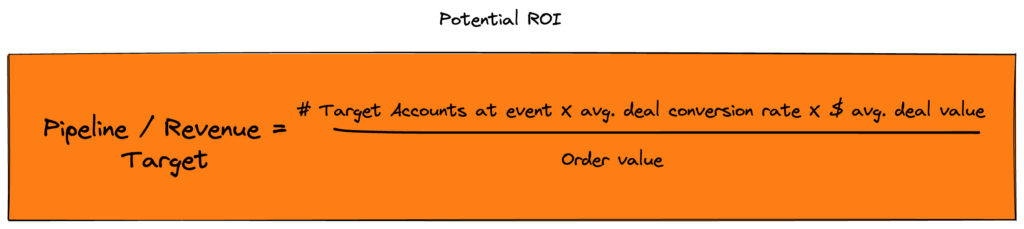
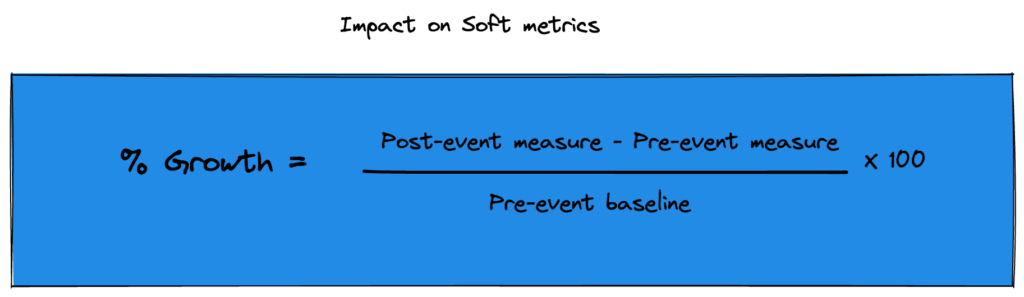
Remember, you need different metrics for business-optimized vs. experience-optimized events. Depending on who needs the analysis, you can shift the reporting from a micro view all the way to 30,000 feet. The way you tell the story of the data to different stakeholders matters.
The more data you’re able to collect, the better you can speak everyone’s language and demonstrate how events fit into their frameworks for success as well.
ELG is your strategic weapon for ROE
ELG as a framework helps you think wider and deeper about how to integrate marketing efforts and campaigns together to create not just one-off instances, but continuous growth. That’s a big promise, so it has to be backed by data and methodology in order to build a case for future investment.
If pipeline is the only goal anyone is paying attention to, events will never be recognized as the growth drivers they truly are.
Proving that events can be a center of gravity means clearly tying their impact to business outcomes. Under the ELG framework, you should be tracking data not just around or a few months after the day of your event, but all year long.
There’s so much to learn from looking at events dashboards month to month—what activity are you seeing? Are attendees watching your content? Are you getting more follows or downloads? You want to be looking at the lifetime of an event campaign in order to truly demonstrate how much value you’ve created.
What are the Key Metrics for Measuring the Impact of an Event?

Hosting an event requires a significant investment of your time and financial resources. Isn’t that so? To assess the overall success of the event, its impact, and whether it achieved its objectives, it’s essential to evaluate key performance indicators (KPIs).
Event KPIs will not only allow you to measure the success of your entire program but also help you calculate its ROI. It will additionally provide you with valuable insights that you can use to improve future programs.
Let’s explore the key metrics that will define the event’s success.
- Registration: Registration is one of the easiest metrics to track, but it’s also one of the most important. This metric tracks the number of people who registered for an event.
A massive attendance at your event indicates the audience’s genuine interest in the program and the effectiveness of your marketing strategies. Registration data actually helps understand your event reach and predict the overall success of an event. - Attendance Rate: People have shown interest in registering for your event, now it’s time to figure out how many actually attended. Not everyone who registers will attend the event. Their schedules can change unexpectedly, making it difficult for some to attend.
A successful event involves many factors, but this is a critical first step towards the success of the event. So, kindly make an attendance tracking an integral part of the event management process. - Attendee Engagement: Track this metric to gauge the overall engagement of your audience at the event. This includes monitoring Q&A sessions, chat activity, and poll responses, providing data-driven insights into which activities your audience found most engaging. Also, you can better understand whether your content, speakers, and format were able to engage the audience.
- Attendee Retention: Don’t overlook this metric. There are high chances that your present event has had a few repeat attendees. When your event has a high recurring audience, it means your event is meeting their expectations and providing value.
For example, if there are 50 repeat attendees from your 200 people who attended the current event, then the attendee retention rate is 25%. - Speaker Engagement: In order to check the effectiveness of the presentation, track speaker engagement. The speaker is the first person the audience interacts with. Did the audience enjoy the speaker’s presentation? Were they actively listening? Was the presentation engaging? Did people interact with the speaker in real-time? Measure all of these things.
- Email Campaign Performance: If you’ve run email campaigns to promote your event, don’t forget to monitor them. Track open rate, click-through rate, and more metrics to identify how effective the campaign was. You will get a sense of whether they completed certain actions you asked for, such as registration for your event. Tracking email campaign performance will allow you to modify your content and subject lines for better outcomes in subsequent campaigns.
- Leads Generated: If your event goal is to capture leads for your business, measure the number of qualified leads you have generated. This is considered the most important KPI for measuring the success of a program, especially for B2B events. Measure both the number of leads collected from the event and the number of leads generated via follow-up emails. This will help you generate new business in the future.
- Conversion Rate: Checking conversion tracking is basically the process of checking how effectively audiences are moving through your desired funnel, like making a purchase, signing up for a newsletter, filling a form, and so on. Keeping track of conversions not only provides you solid data about the ROI of an event but also gives you a perspective to better plan future programs.
- Net Promoter Score (NPS): The Net Promoter Score (NPS) is a metric that measures customer loyalty and satisfaction. It involves asking simple questions to event attendees on a scale of 1 to 10.
For example, if you ask a question like how likely are you to recommend this event to a friend, and family?
A score of 9-10 out of 10 indicates that they are highly likely to promote your brand to others; a score of 7-8 indicates that attendees are satisfied but hesitant to refer your offering; and a score of 0-6 indicates that they are dissatisfied with the product you sell. - Gross Revenue: The ultimate metric that defines the success of an event is gross revenue. It measures the total revenue you have generated from all sources, such as ticket sales, sponsorships, and merchandise. This tool is truly essential for calculating sales and forecasting business growth.
Events drive growth—now go prove it
Old ways of thought saw events as nice-to-haves rather than the integral growth strategy they really are. Most business goals can be addressed by events—events solve problems and hit targets, and they do so holistically.
With one good event, you can build brand awareness, create influence, earn immediate short-term revenue, provide unique content you can leverage later, and gain deep audience insights you can use for strategy.
Using ELG, you too can not just plan the right event for the right audience at the right time but also learn how to measure it so everyone can see the value events bring. With a few numbers, events can be a thread through your entire organization’s growth strategy, and you can be the one to bring that strategy to life.
Frequently asked questions
You need an event management platform for tracking registration numbers, attendance rate, attendee engagement, & marketing automation, CRM systems like HubSpot or Salesforce for tracking leads, & conversion rate, and Google Analytics to gauge the website traffic and landing page performance.
Quantitative data include sales figures, cost savings, customer acquisition rates, and website traffic. As well as qualitative data like customer feedback, and employee satisfaction surveys. And lastly financial data such as revenue, profit margin, and return on investment.